Can AI be Used to Predict Water Sanitary Risk in Real Time?
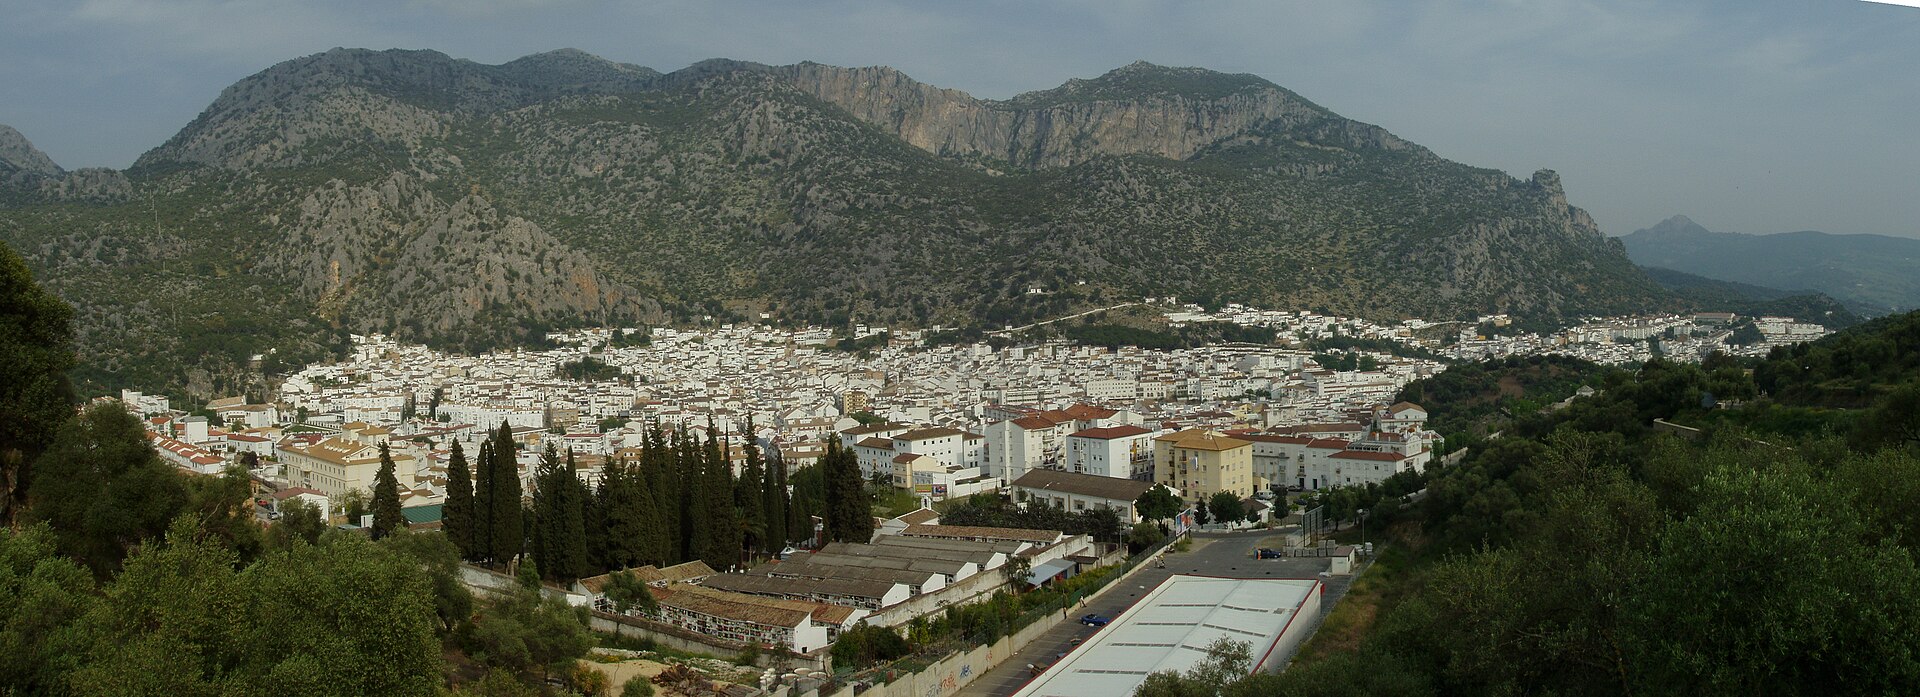
Featured Image Caption: Panoramic view of Ubrique Spain by Malopez 21, CC BY-SA 4.0, via Wikimedia Commons
Primary article
Fernández-Ortega, J., Barberá, J. A., & Andreo, B. (2026). New insights into machine learning prediction techniques for real-time sanitary risk assessment in karst drinking water sources affected by faecal contamination. Water Research (Oxford), 290, Article 125060. https://doi.org/10.1016/j.watres.2025.125060
Secondary articles:
Levin, R., Villanueva, C.M., Beene, D. et al. US drinking water quality: exposure risk profiles for seven legacy and emerging contaminants. J Expo Sci Environ Epidemiol 34, 3–22 (2024). https://doi.org/10.1038/s41370-023-00597-z
Tao, Y., & Gao, P. (2025). Global data center expansion and human health: A call for empirical research. Eco-Environment & Health, 4(3), 100157. https://doi.org/10.1016/j.eehl.2025.100157
Ward, J. S. T., Lapworth, D. J., Read, D. S., Pedley, S., Banda, S. T., Monjerezi, M., Gwengweya, G., & MacDonald, A. M. (2021). Tryptophan-like fluorescence as a high-level screening tool for detecting microbial contamination in drinking water. The Science of the Total Environment, 750, Article 141284. https://doi.org/10.1016/j.scitotenv.2020.141284
Zerga, B. (2024). Karst topography: Formation, processes, characteristics, landforms, degradation and restoration: A systematic review. Watershed Ecology and the Environment, 6, 252–269. https://doi.org/10.1016/j.wsee.2024.10.003
https://www.coursera.org/articles/what-is-machine-learning
https://www.epa.gov/report-environment/drinking-water
https://www.usgs.gov/publications/chemical-tracer-methods
How do you know that your drinking water is safe? Virtually all drinking water in the United States comes from fresh surface waters and ground water aquifers that are then treated by a public water system. However, water can still be contaminated by chemicals, microbes, and radionuclides. Radionuclides are radioactive isotopes dissolved into water supplies from contaminated rocks and soil from industrial waste. This contamination is caused by industry, agriculture, human and animal waste, byproducts of treatment used to remove contaminants, natural sources present in local underground soil, sewer overflows, and cracked pipes.
It is important to monitor drinking water quality to maintain community health, but traditional water testing methods can be costly and labor intensive. They cannot account for rapid variations in water quality that can happen as quickly as an hour.
For this reason, researchers propose the use of machine learning as a new method to indirectly measure water quality and as an early-warning protection tool for safeguarding drinking water.
Using continuous water samples in two spring water sites draining a karst aquifer in Spain, researchers used machine learning (ML) to provide real-time insights on water quality. Water samples were tested for turbidity, electrical conductivity, and Tryptophan-Like-Fluorescence, an optical water screening method that uses UV fluorescence to detect the amino acid tryptophan. This amino acid is present in active bacteria and can help detect the presence of bacteria.
Although researchers were able to develop effective predictions from the two spring water sources, they stressed that data validation is still needed by using traditional culture methods.

E.coli is known to cause enteric diseases and is easily transported in water. The collective parameters that were chosen in this study provide details about microbial contamination. For example, electrical conductivity of water provides information of dissolved salts and other inorganic chemicals in water.
Changes of electrical current in the water from its baseline can mean there is a disturbance in the water, this could indicate potential microbial activity. Turbidity is all about the clarity of a liquid. A lack of clarity indicates that there are potential pollutants in the water. The higher the turbidity, the higher the likelihood of pollution. Finally, TLF is used to measure bacterial activity by detecting the L-Tryptophan molecule. Although it does not measure E. coli directly and detects broad microbial activity. It is useful as a proxy test.
An ANOVA was used to statistically determine whether each parameter was a statistically significant predictor of microbial contamination. Significant values were used for ML models.
What is Machine Learning and Where Does it Fit with AI?

Before diving into the study, it is important to understand machine learning. Machine learning is a type of artificial intelligence that makes predictions of a given outcome. Essentially, a program is fed a set of rules called algorithms, given past data sets based on these algorithms, and then asked to predict the future based on this information.
It sounds simple, but the process requires statistical thinking, including a careful input of parameters, data sets, and refinement of data sets based on what the researcher hopes to study and predict. Various iterations of machine learning have been around for 80 years. You interface with machine learning everyday.
Whenever you get a recommendation for a product via targeted ads, your bank flags a suspicious purchase as potential fraud, or you use speech recognition software, you are interfacing with machine learning. In terms of ML to improve water quality, ML has been used to predict arsenic and fluoride in aquifers, but not faecal bacteria. E. coli is typically found in fecal matter so in this study, ML was applied to look at this type of contamination.
Understanding the Test Site: Go with the Flow and Uncover the Water Source

When researchers tackle a problem as big as water sanitation risk, they don’t just grab water samples, plug in some numbers, and call it a day. They have to understand the hydrogeology of how water is being fed into the study system before deciding where to collect water samples.
Researchers are detectives as much as they are scientists. Using water tracer tests, an understanding of the regional geology, weather patterns, and human activity relevant to the test site, scientists put together Ubrique’s water supply story.
In the northeastern province of Cadiz is a pueblo called Ubrique. It is a rural town known for tanning leather, goat and sheep livestock farming, cheese industry, and has a wastewater treatment plant (WWTP) 150 m upstream from a neighboring village.The majority of residents living here get their water supply from Sierra de Ubrique binary karst aquifer. Essentially, a binary karst aquifer is a groundwater system that receives water from direct rainfall and runoff from another secondary source.
The aquifer recharges through multiple sources: by rainfall, flysch catchment, and spring overflow near the Algarrobal. In addition, ground pressure from livestock activity and the WWTP contribute to the karst. Manure, fertilizer, and pesticide use caused by agricultural activities transports nitrogen into groundwater, giving bacteria an opportunity to grow and thrive. Similarly, discharge from the wastewater treatment plant transports nitrogen and phosphorus to the aquifer.
Based on a field tracer test result conducted a few years earlier, the researchers decided to focus collections at two different sites: Algarrobal and Cornicabra. Both of these water sources feed into the main aquifer.
Water Pollution: If it Doesn’t Show Up in the Wash, it Shows up in the Rinse!
If it doesn’t show up in the wash, it shows up in the rinse. This adage works for this experimental study, as the quality of groundwater reveals itself over time. Spring discharge helps analyze the anthropogenic and climate impacts on groundwater, especially after rainwater events. In this case, studying the Algarrobal and Cornicabra spring discharge provides microbial clues that will determine the sanitary risk of the Ubrique aquifer.
After researchers understood what water sources were feeding the aquifer, they were ready to collect their samples. Between 2020 and 2023, a total of 194 groundwater samples were collected from these two springs. Researchers recorded electrical conductivity, turbidity, Tryptophan-like-Fluorescence (TLF), and sanitary risk measurements for E. coli. Each of these variables provides information on whether water is safe to drink.
Model Selection for Predictive Modeling
Once parameters were determined (electrical conductivity, spring discharge, turbidity, thresholds for safe/unsafe E. coli, etc), it was time to train the ML to do predictive modeling. Predictive modeling is a statistical technique used to forecast an outcome based on past data and algorithms.
Based on the data collected from water sampling, the AI system was trained through ten modeling tools to predict the remaining variables in the data set and recognize patterns within the data set. To prevent model bias and to obtain a more accurate estimate, a stratified cross-validation was performed and a receiver operating curve was used to select the best modeling method with the lowest error rate.
An easier way to think about the process is that the ML was trained and then asked to perform. The sequence of events sounds something like this: Here is the data of the water samples we collected. Learn its patterns. Now, based on new input and the mathematical rules (algorithms) that have been provided to you, what are the patterns between the different categories studied? Estimate and predict the level of E. coli contamination using your best performance test run and what we have classified as none, low, medium, high, and very high E. coli counts per mL.
Although there is more nuance in training ML, this was the overall goal of the study.
Tracer tests, a common diagnostic test that hydrologists used to monitor a water’s path, were also used to determine whether the ML’s data results made sense with what was actually occurring at the spring sites.
Not all Spring Karsts are Considered Equal
Both springs responded differently to rain events even though they were both draining to the same aquifer. Cornicabra has a directly proportional relationship for spring discharge, turbidity, and TLF while electrical conductivity has an inverse relationship. For Algarrobal spring, all parameters had a proportional relationship. Algarrobal had nearly double the amount of E. coli.
Not all karst systems respond to environmental pressures the same way and each karst will have different parameters for ML to study. Out of the ten algorithms used to train ML, four performed poorly and four performed the best data results for both springs. Overall, it was a success story for the Spanish researchers.
Although the results of the tracer test made sense with the prediction of ML, they recommend that a proper validation is needed by occasional water sampling and traditional culture methods based on the site of interest. They further assert that these advances could improve water source protection strategies.
Is AI Good or Bad: The Intersection of Social and Environmental Pressure
Although AI has been the driving force in diagnosing diseases, energy management, and biodiversity monitoring, it has also increased social and environmental pressure. Data centers that house larger models place demands on electricity, water, and the supply of minerals, as well as cause noise and air pollution. Communities near these data centers are the most vulnerable. Can anyone guess where these data centers are built and where they expect to expand? They are primarily rural areas in the South and the Midwest United States. It is estimated that in 2030, U.S. data centers could contribute to nearly 1300 deaths annually, resulting in a public health burden that exceeds $20 billion. Power data centers will have to rethink how they run their infrastructure. Using a water monitoring system that impacts water systems is not a sustainable strategy, so further research is needed to find a suitable solution to the water quality monitoring problem
Interested in learning about machine learning, AI, and geology? Check out the videos below!
Video on how AI uses drinking water.
How AI uses our drinking water – BBC World Service
What is a flysch?
Geopark of the Basque Coast: the Earth’s history book
Reviewed by: